VIX Hits Pandemic Era Peak, Investor Jitters Rise
This week, the fear gauge's dramatic surge reflects escalating investor anxiety over a potential economic downturn, mostly exacerbated by the Federal Reserve's decision to maintain interest rates last month and lower-than-expected tech giant earnings reports.
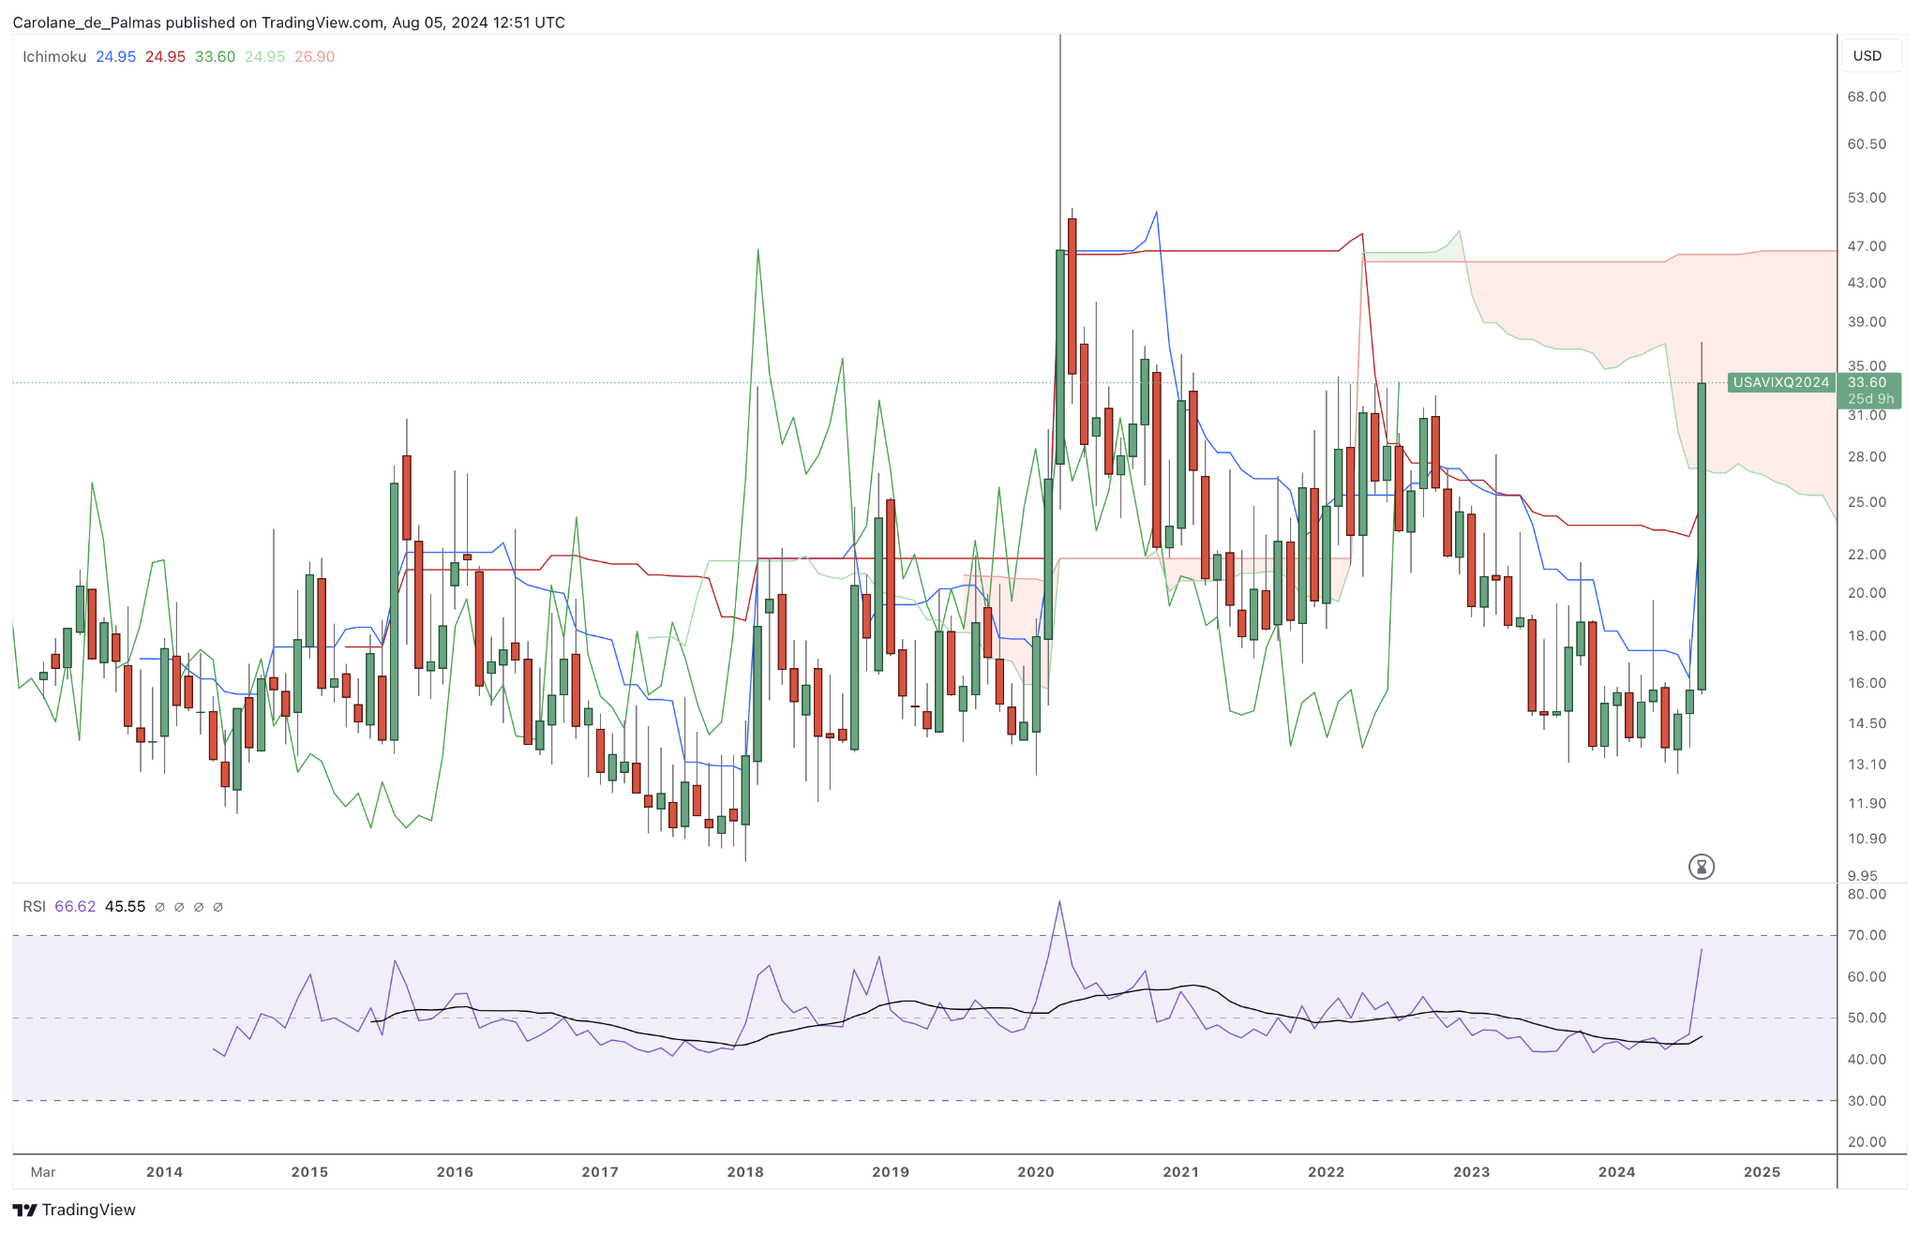 Monthly VIX Chart on Monday 5ht of August Before Wall Street’s Opening - Source: TradingView with ActivTrades’ Data
Understanding the VIX: Introduction to the Fear Index
The VIX, also known as the Volatility Index, is commonly referred to as the market's "fear gauge." This metric provides insight into market volatility, specifically reflecting the anticipated fluctuations of the S&P 500 index within the upcoming 30-day period.
Therefore, the VIX is a tool for traders of all levels, offering valuable insights into market sentiment and potential trading opportunities.
When the VIX is high, it suggests a higher level of investor concern and expectations for greater market volatility. These market conditions can create favourable opportunities for option traders, as the prices of options typically increase during periods of volatility. Nevertheless, remember that excessive volatility can result in substantial losses.
On the other hand, a low VIX indicates a more quiet market with reduced anticipated volatility. Although it may appear less thrilling, it can prove advantageous for investors in search of stability. During times of low volatility, there are chances for long-term investors to acquire high-quality assets at appealing prices.
Having a strong grasp on risk management is crucial when it comes to trading. Through careful observation of the VIX, traders can assess market sentiment and make appropriate adjustments to their portfolio allocations. During times of heightened volatility, it may be wise to decrease investments in stocks and instead allocate more funds to assets with lower volatility.
VIX on Fire: What's Fueling the Volatility?
Investor sentiment plummeted on Monday, August 5th, as both the VIX and CNN Fear & Greed indices plunged into extreme fear territory. The Fear & Greed Index, a widely watched measure of market sentiment, indicated extreme investor pessimism. This index combines seven key indicators, including stock price momentum, market breadth, and options trading activity, to gauge the overall emotional state of the market.
Monthly VIX Chart on Monday 5ht of August Before Wall Street’s Opening - Source: TradingView with ActivTrades’ Data
Understanding the VIX: Introduction to the Fear Index
The VIX, also known as the Volatility Index, is commonly referred to as the market's "fear gauge." This metric provides insight into market volatility, specifically reflecting the anticipated fluctuations of the S&P 500 index within the upcoming 30-day period.
Therefore, the VIX is a tool for traders of all levels, offering valuable insights into market sentiment and potential trading opportunities.
When the VIX is high, it suggests a higher level of investor concern and expectations for greater market volatility. These market conditions can create favourable opportunities for option traders, as the prices of options typically increase during periods of volatility. Nevertheless, remember that excessive volatility can result in substantial losses.
On the other hand, a low VIX indicates a more quiet market with reduced anticipated volatility. Although it may appear less thrilling, it can prove advantageous for investors in search of stability. During times of low volatility, there are chances for long-term investors to acquire high-quality assets at appealing prices.
Having a strong grasp on risk management is crucial when it comes to trading. Through careful observation of the VIX, traders can assess market sentiment and make appropriate adjustments to their portfolio allocations. During times of heightened volatility, it may be wise to decrease investments in stocks and instead allocate more funds to assets with lower volatility.
VIX on Fire: What's Fueling the Volatility?
Investor sentiment plummeted on Monday, August 5th, as both the VIX and CNN Fear & Greed indices plunged into extreme fear territory. The Fear & Greed Index, a widely watched measure of market sentiment, indicated extreme investor pessimism. This index combines seven key indicators, including stock price momentum, market breadth, and options trading activity, to gauge the overall emotional state of the market.
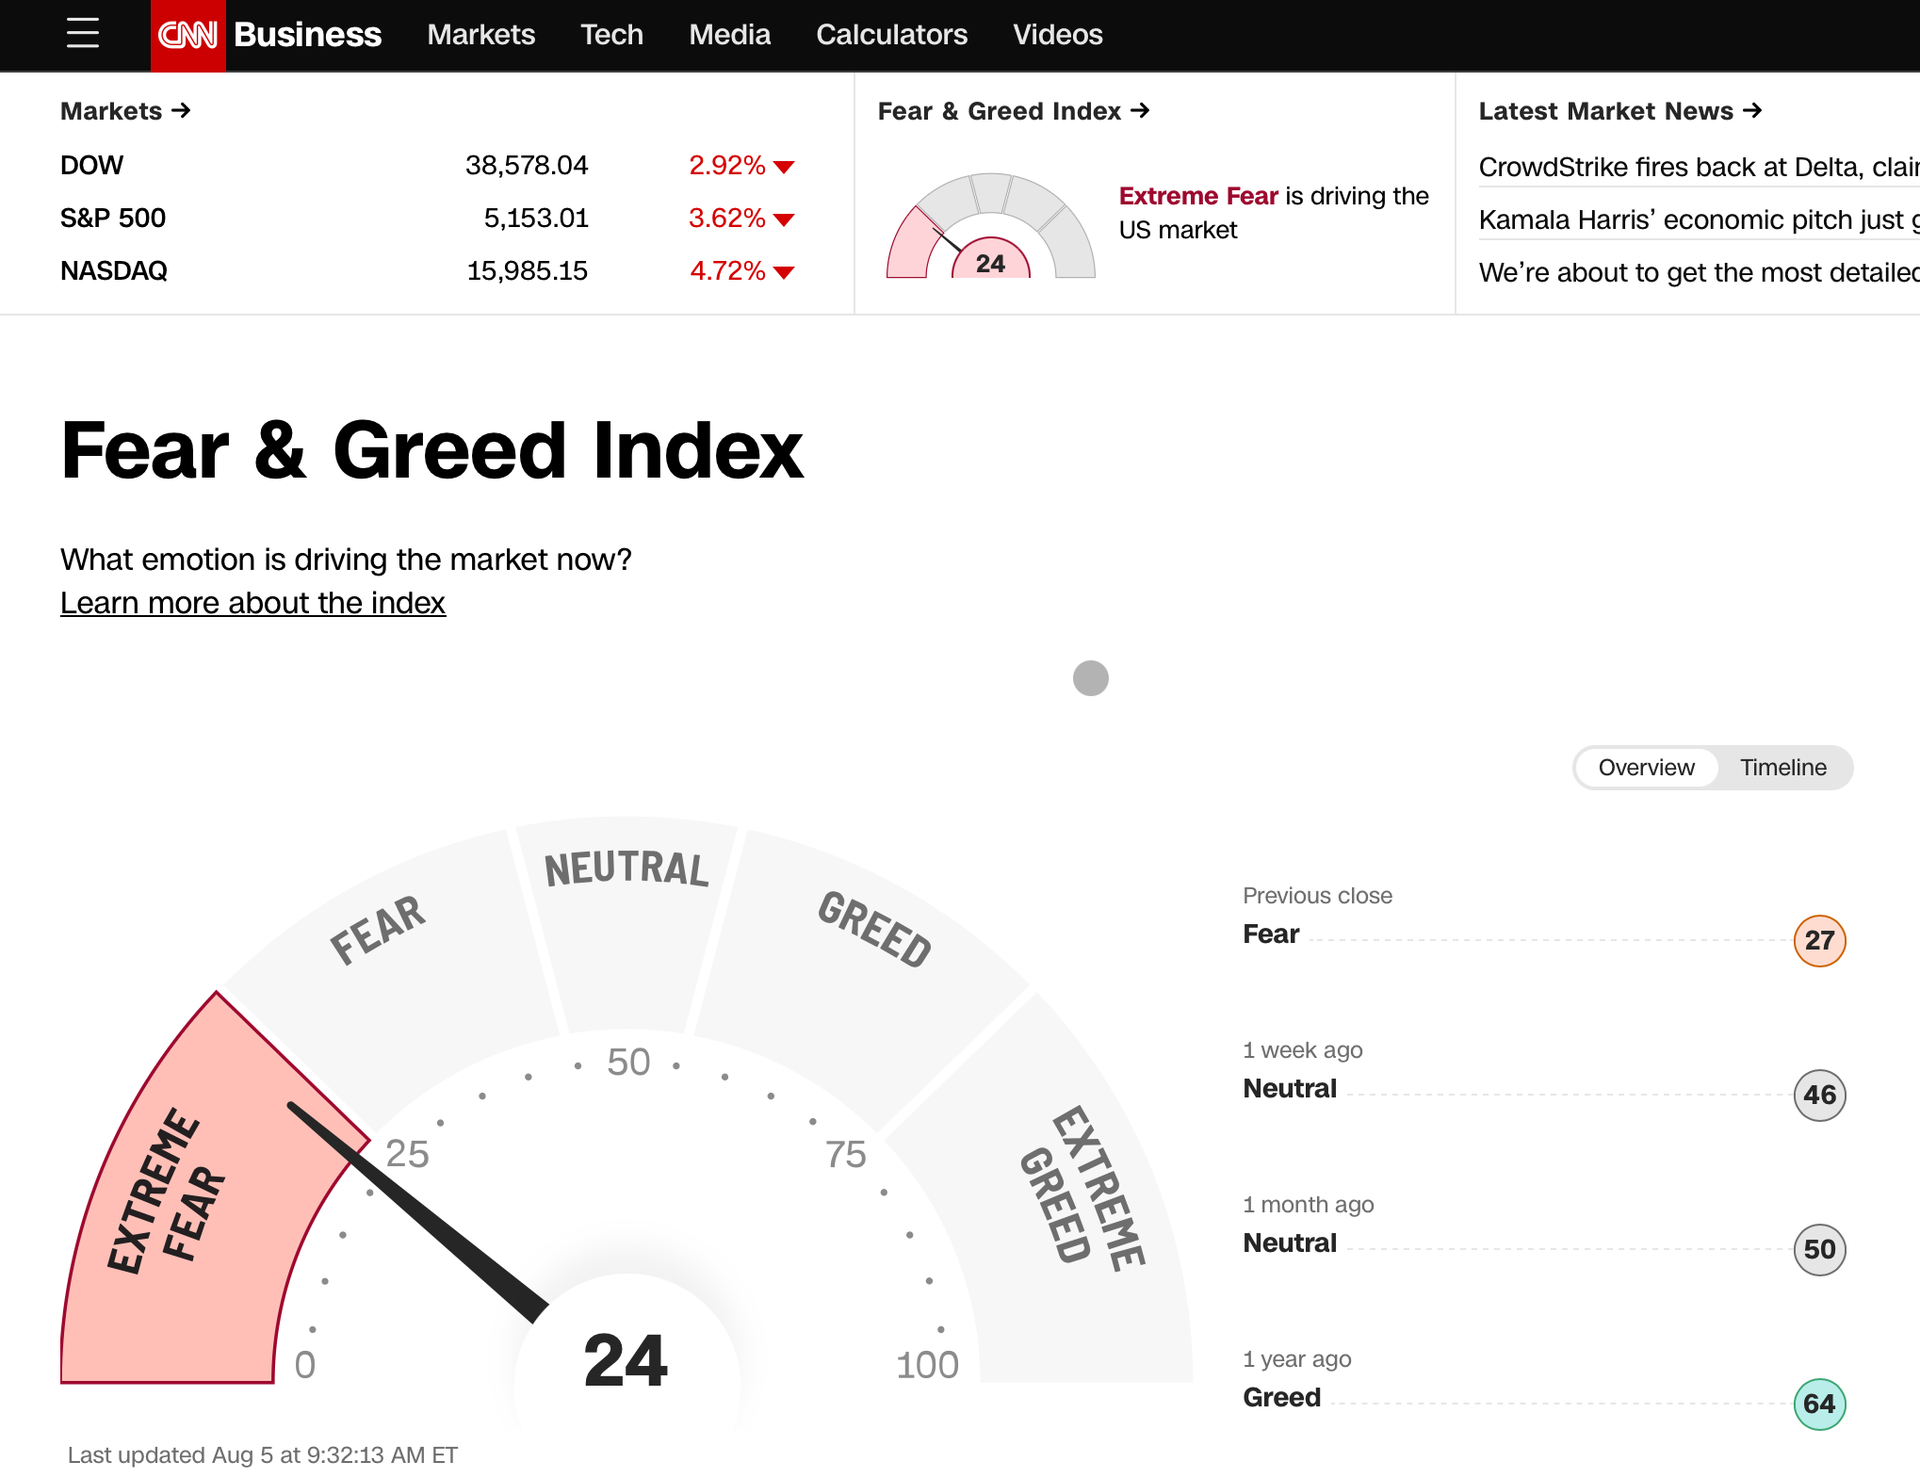 Fear and Greed Index - Source: CNN
The recent surge in the VIX and CNN Fear and Greed index can be attributed partly to the significant decline in tech stocks, resulting in a negative impact on the NASDAQ and other US equity indices. The NASDAQ has experienced a significant decline of almost 10% over the past three weeks, which is the worst performance to the market downturn observed since September 2022.
During that time, there were concerns about rising inflation and the impact of aggressive interest rate hikes of the Fed, which has been rapidly increasing the Fed Funds rates to fight inflation.
This week, the tech-heavy index has experienced a significant drop of over 4.5%, causing increased concerns among investors and leading to a rise in market volatility. It's clear that the decline of these tech giants, which have been major market drivers, is causing a ripple effect across the broader market and leading to a spike in the VIX.
Fear and Greed Index - Source: CNN
The recent surge in the VIX and CNN Fear and Greed index can be attributed partly to the significant decline in tech stocks, resulting in a negative impact on the NASDAQ and other US equity indices. The NASDAQ has experienced a significant decline of almost 10% over the past three weeks, which is the worst performance to the market downturn observed since September 2022.
During that time, there were concerns about rising inflation and the impact of aggressive interest rate hikes of the Fed, which has been rapidly increasing the Fed Funds rates to fight inflation.
This week, the tech-heavy index has experienced a significant drop of over 4.5%, causing increased concerns among investors and leading to a rise in market volatility. It's clear that the decline of these tech giants, which have been major market drivers, is causing a ripple effect across the broader market and leading to a spike in the VIX.
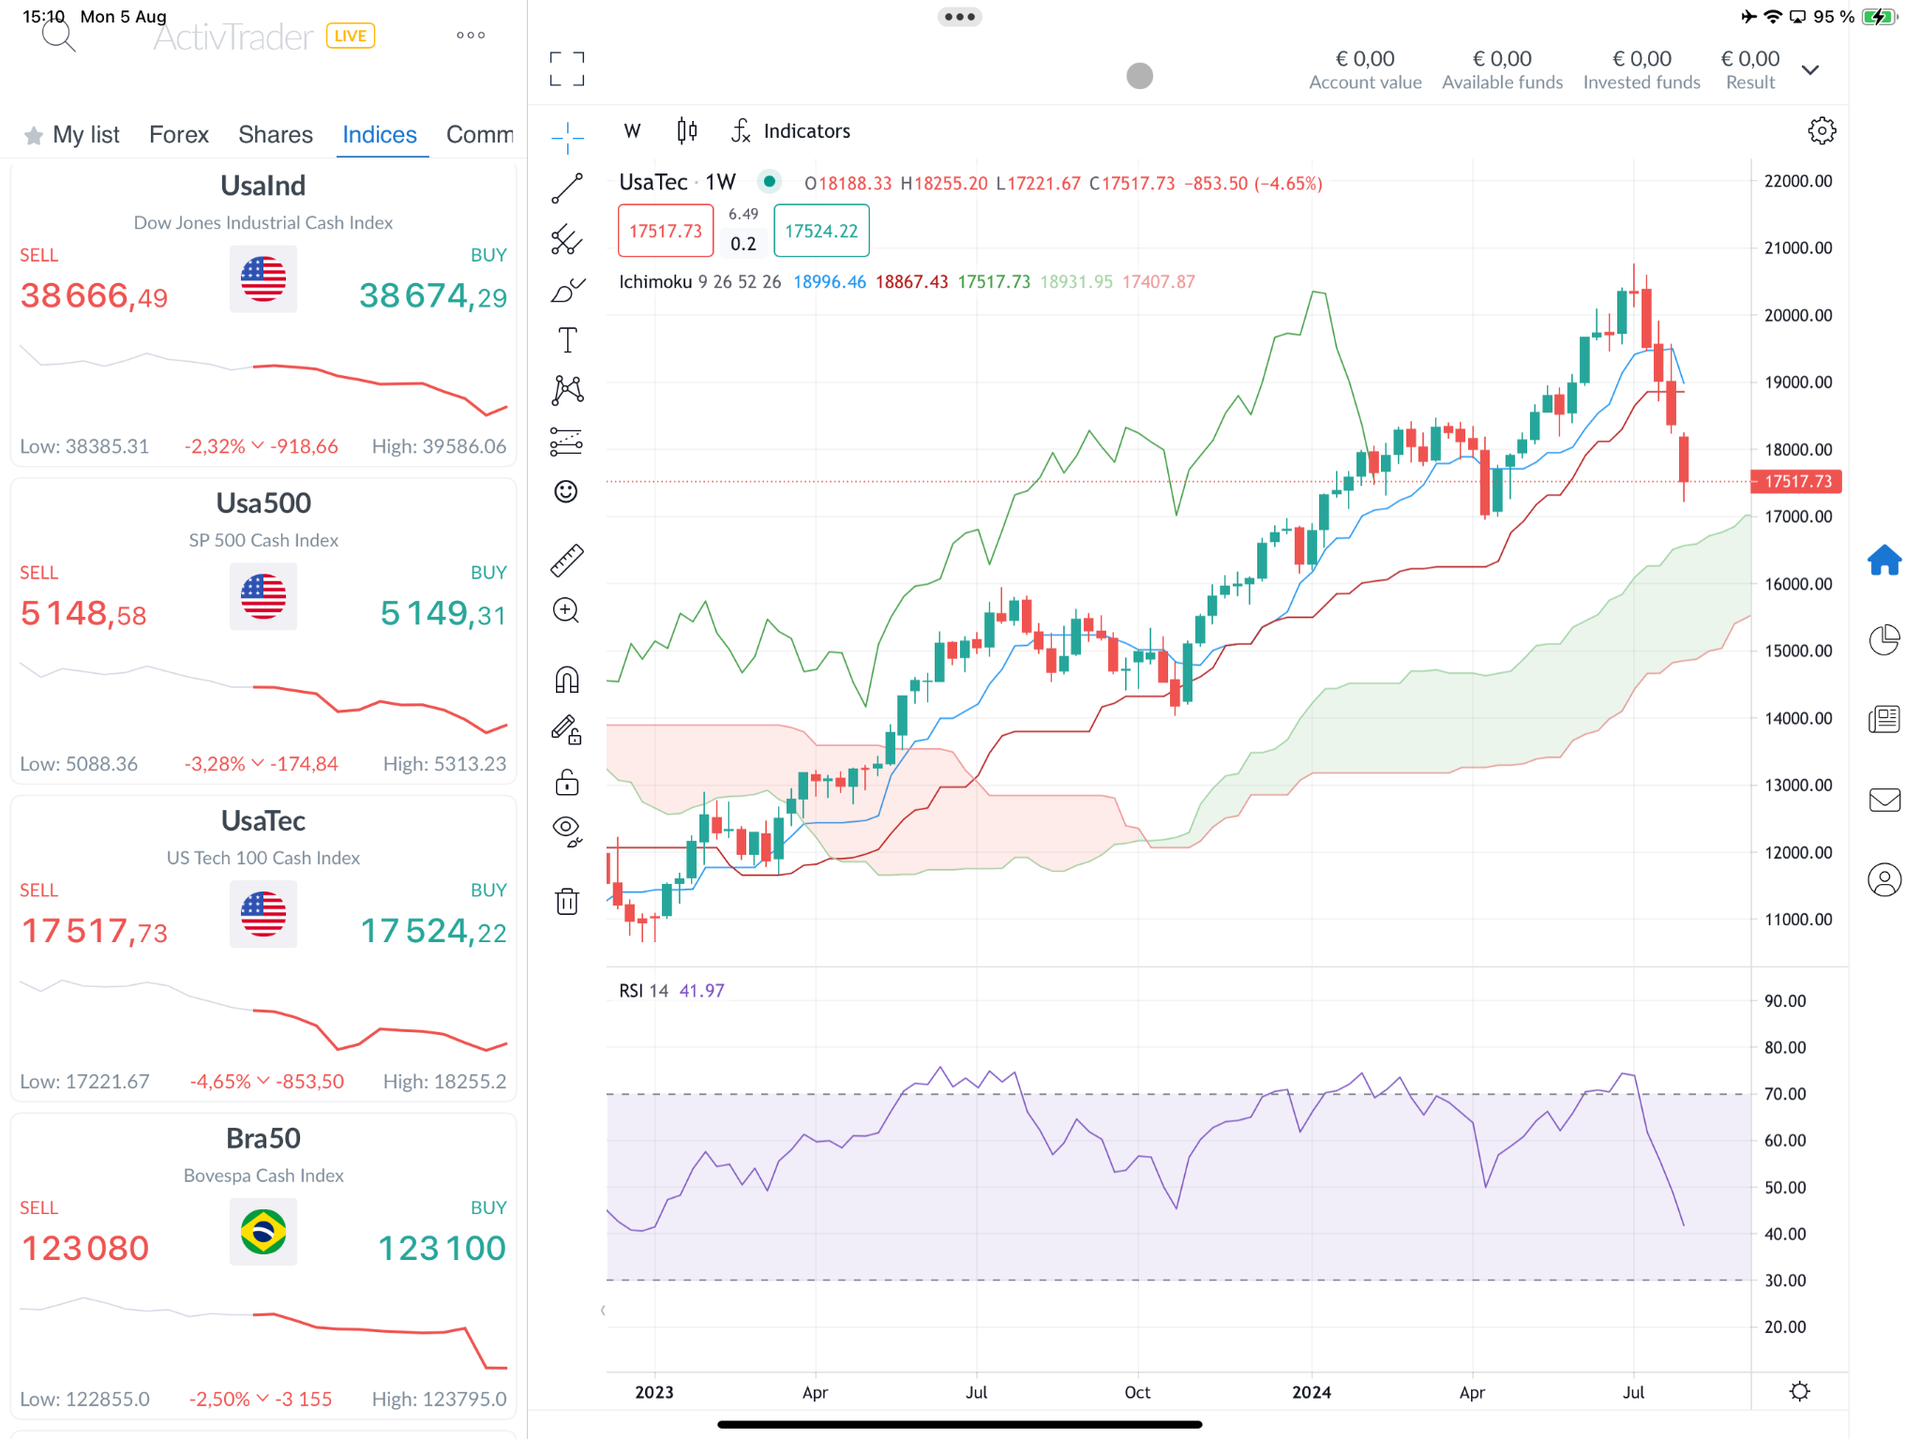 Weekly Nasdaq Chart - Source: ActivTraders on iPad
A steady climb has been experienced by the technology sector since late 2022. This rally has been boosted by a reviving economy in the United States as well as the seductive promise of artificial intelligence.
The sector was riding a wave of optimism, fuelled by the promise that artificial intelligence would revolutionise a wide variety of industries, from education to writing. The current earnings season, on the other hand, is a strong dose of reality.
Previously optimistic projections have been called into question as an increasing number of IT companies have announced outcomes that are less than satisfactory. The development of artificial intelligence infrastructure has given rise to concerns over slower-than-anticipated growth and potential obstacles.
This shift in mood has been most noticeable in the share prices of industry giants like Amazon, Intel, Microsoft, and Nvidia, which all witnessed large drops over the course of the past week.
Weekly Nasdaq Chart - Source: ActivTraders on iPad
A steady climb has been experienced by the technology sector since late 2022. This rally has been boosted by a reviving economy in the United States as well as the seductive promise of artificial intelligence.
The sector was riding a wave of optimism, fuelled by the promise that artificial intelligence would revolutionise a wide variety of industries, from education to writing. The current earnings season, on the other hand, is a strong dose of reality.
Previously optimistic projections have been called into question as an increasing number of IT companies have announced outcomes that are less than satisfactory. The development of artificial intelligence infrastructure has given rise to concerns over slower-than-anticipated growth and potential obstacles.
This shift in mood has been most noticeable in the share prices of industry giants like Amazon, Intel, Microsoft, and Nvidia, which all witnessed large drops over the course of the past week.
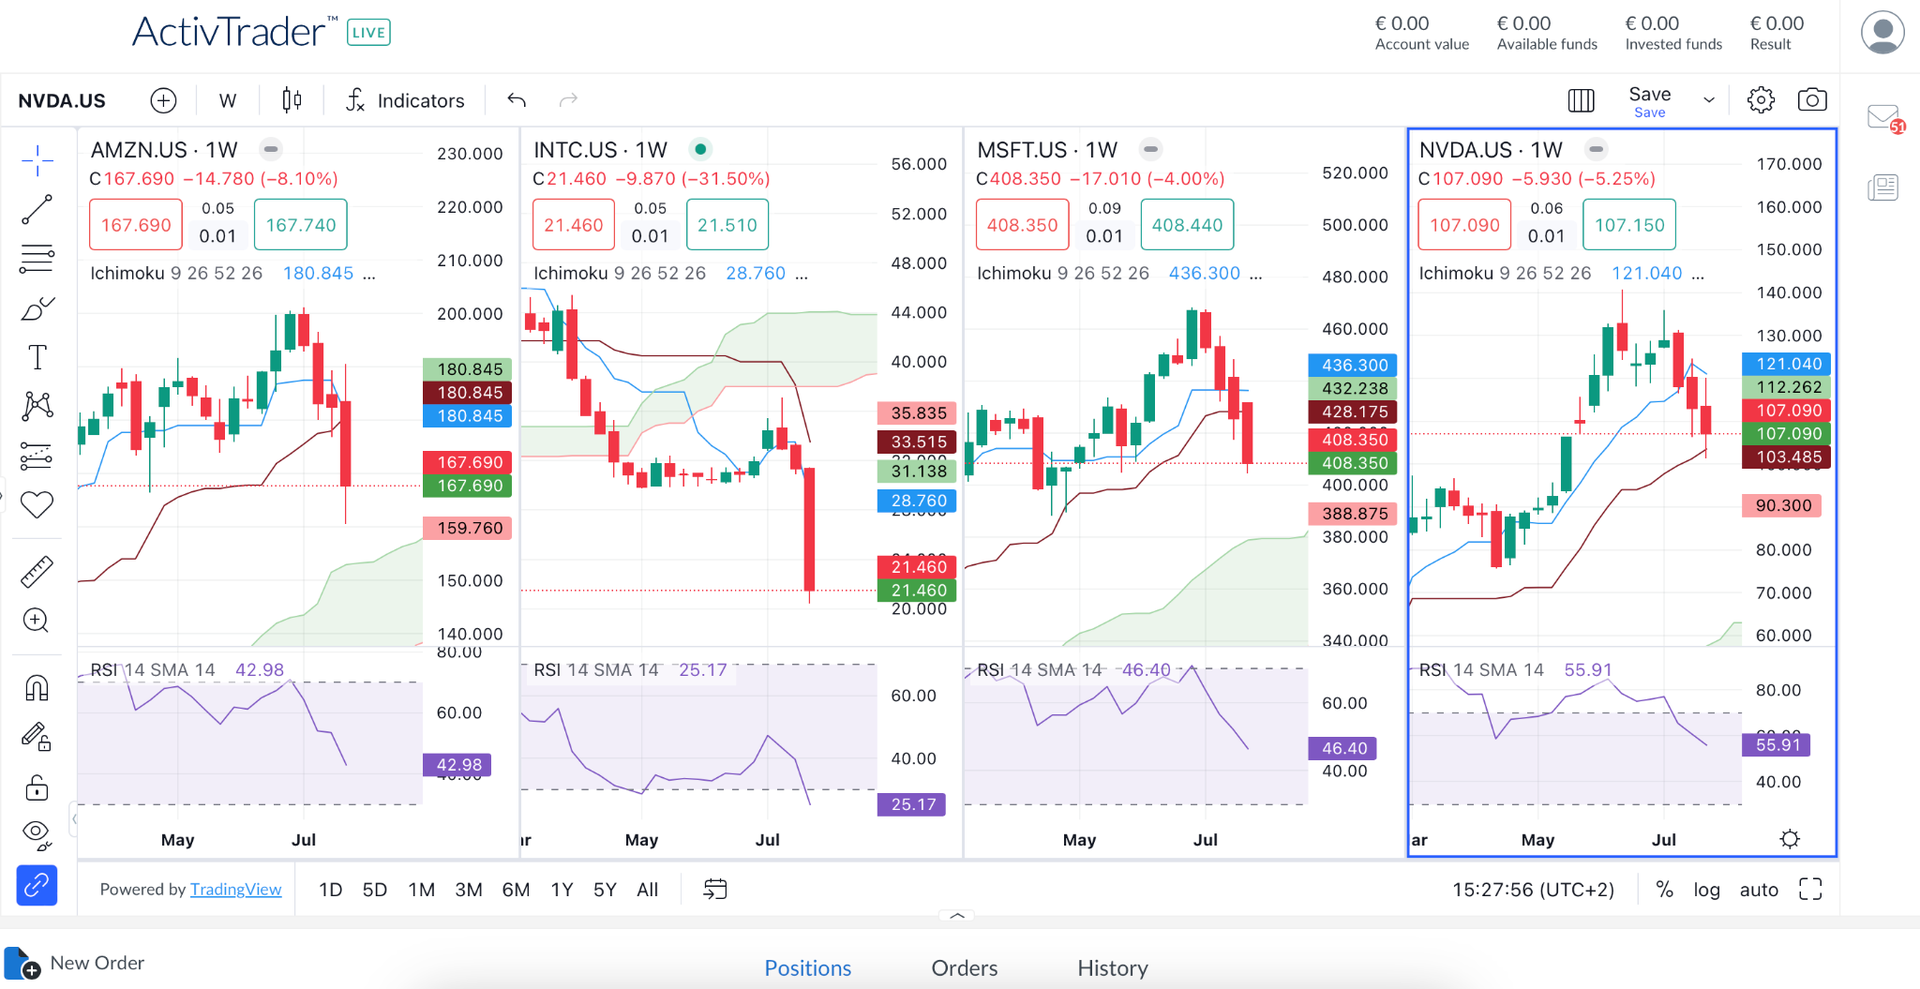 Weekly Amazon, Intel, Microsoft, and Nvidia Charts - Source: ActivTrader on Computer
The effects of the growing economic headwinds are also having a negative impact on overall market sentiment. A steep slowdown in job creation, as demonstrated by the American employment data for the month of July, has sparked fears about the possibility of a recession breaking out.
The figures from the Labour Department showed that there were only 114,000 new jobs created in July, which is far lower than anticipated, representing a considerable slowdown compared to the previous months. The average growth job creation over the last 12 months was 215,000.
At the same time, the unemployment rate increased to 4.3%, its highest level since October 2021. This caused several economic models to become concerned about the possibility of a recession and raise alarms.
The information provided does not constitute investment research. The material has not been prepared in accordance with the legal requirements designed to promote the independence of investment research and as such is to be considered to be a marketing communication.
All information has been prepared by ActivTrades (“AT”). The information does not contain a record of AT’s prices, or an offer of or solicitation for a transaction in any financial instrument. No representation or warranty is given as to the accuracy or completeness of this information.
Any material provided does not have regard to the specific investment objective and financial situation of any person who may receive it. Past performance is not a reliable indicator of future performance. AT provides an execution-only service. Consequently, any person acting on the information provided does so at their own risk.
Weekly Amazon, Intel, Microsoft, and Nvidia Charts - Source: ActivTrader on Computer
The effects of the growing economic headwinds are also having a negative impact on overall market sentiment. A steep slowdown in job creation, as demonstrated by the American employment data for the month of July, has sparked fears about the possibility of a recession breaking out.
The figures from the Labour Department showed that there were only 114,000 new jobs created in July, which is far lower than anticipated, representing a considerable slowdown compared to the previous months. The average growth job creation over the last 12 months was 215,000.
At the same time, the unemployment rate increased to 4.3%, its highest level since October 2021. This caused several economic models to become concerned about the possibility of a recession and raise alarms.
The information provided does not constitute investment research. The material has not been prepared in accordance with the legal requirements designed to promote the independence of investment research and as such is to be considered to be a marketing communication.
All information has been prepared by ActivTrades (“AT”). The information does not contain a record of AT’s prices, or an offer of or solicitation for a transaction in any financial instrument. No representation or warranty is given as to the accuracy or completeness of this information.
Any material provided does not have regard to the specific investment objective and financial situation of any person who may receive it. Past performance is not a reliable indicator of future performance. AT provides an execution-only service. Consequently, any person acting on the information provided does so at their own risk. Publication date:
2024-08-05 14:56:04 (GMT)