VIX Hits Pandemic Era Peak, Investor Jitters Rise
Market turmoil erupted in August 2024 as the VIX skyrocketed over 112% to more than 37, reaching its highest level since the Covid-19 pandemic in 2020, according to ActivTrades’ VIX S&P500 CFD. In March 2020, the VIX reached a level higher than 80.
RBNZ Monetary Policy: Will the NZD/USD Keep Rising?
The NZDUSD currency pair has had a rough few years, experiencing annual declines in 2021 (-5.05%), 2022 (-6.93%),and 2023 (-0.45%). So far in 2024, it's down over 2.85%, reaching its lowest point since November 2023 (0.58515) in April. However, there are signs of a potential turnaround. In recent months, the NZDUSD has climbed over 4.19%. Could this be the start of a sustained upward trajectory?
Several factors hint at a potential turnaround. Speculation swirls about a U.S. rate cut as early as September 2024, potentially weakening the USD. Additionally, hawkish comments from the Reserve Bank of New Zealand (RBNZ) are somewhat strengthening the NZD, as the RBNZ doesn’t seem ready to cut interest rates..
If you’re trading the NZDUSD, you might be wondering if the FX pair can maintain its upward momentum? What should you monitor during the RBNZ’s upcoming meeting? And what other developments should traders keep an eye on?
The RBNZ is Expected to Maintain its Rate At 5.5% on Wednesday 10th of July
All 20 economists surveyed by Bloomberg expect the Reserve Bank of New Zealand (RBNZ) to maintain the Official Cash Rate (OCR) at 5.5% for the eighth consecutive meeting on Wednesday. This decision comes despite growing market speculation of a rate cut before the end of 2024, fueled by a weakening economy.
New Zealand's economic performance in the first quarter of 2024 offered a glimmer of hope after a worrying slump. The GDP grew by 0.2% quarter-on-quarter, exceeding market expectations of stagnation and bouncing back from a 0.1% contraction in the previous quarter. However, this small expansion comes after two consecutive quarters of negative growth, officially plunging New Zealand into a technical recession for the second time within 18 months despite a strong population growth observed recently.
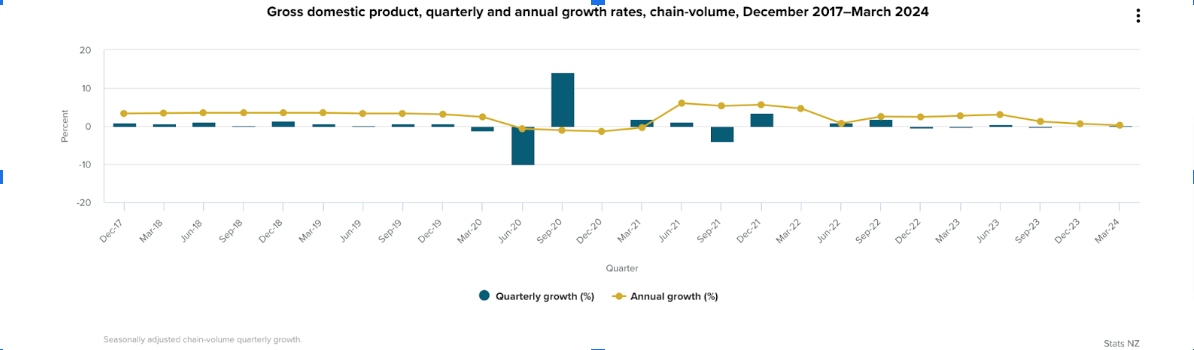 This fragile recovery is further clouded by persistent high inflation. As measured by the Consumer Price Index (CPI), inflation in New Zealand surged 4% year-on-year for the quarter ending March 2024, following a 4.7% increase in December 2023. This significantly exceeds the Reserve Bank of New Zealand's (RBNZ) target inflation range of 1 to 3% over the medium term.
The combined weight of recession and inflation creates a significant challenge for the Reserve Bank of New Zealand. Traditionally, central banks raise interest rates to combat inflation, but such actions can also dampen economic growth too much, which could also be a significant factor for central bankers. Conversely, lowering interest rates can stimulate the economy but could exacerbate inflationary pressures.
In their May meeting, the Reserve Bank of New Zealand projected delaying any potential rate cuts until the third quarter of 2025. Additionally, they even considered raising the OCR further to combat persistent domestic inflation pressures.
While the RBNZ is expected to maintain a hawkish stance, the economic slowdown could prompt them to signal a potential shift in policy direction in the coming months. Traders will be closely watching the RBNZ's statement for any hints about future rate cuts.
Where Might the NZDUSD Be Heading?
This fragile recovery is further clouded by persistent high inflation. As measured by the Consumer Price Index (CPI), inflation in New Zealand surged 4% year-on-year for the quarter ending March 2024, following a 4.7% increase in December 2023. This significantly exceeds the Reserve Bank of New Zealand's (RBNZ) target inflation range of 1 to 3% over the medium term.
The combined weight of recession and inflation creates a significant challenge for the Reserve Bank of New Zealand. Traditionally, central banks raise interest rates to combat inflation, but such actions can also dampen economic growth too much, which could also be a significant factor for central bankers. Conversely, lowering interest rates can stimulate the economy but could exacerbate inflationary pressures.
In their May meeting, the Reserve Bank of New Zealand projected delaying any potential rate cuts until the third quarter of 2025. Additionally, they even considered raising the OCR further to combat persistent domestic inflation pressures.
While the RBNZ is expected to maintain a hawkish stance, the economic slowdown could prompt them to signal a potential shift in policy direction in the coming months. Traders will be closely watching the RBNZ's statement for any hints about future rate cuts.
Where Might the NZDUSD Be Heading?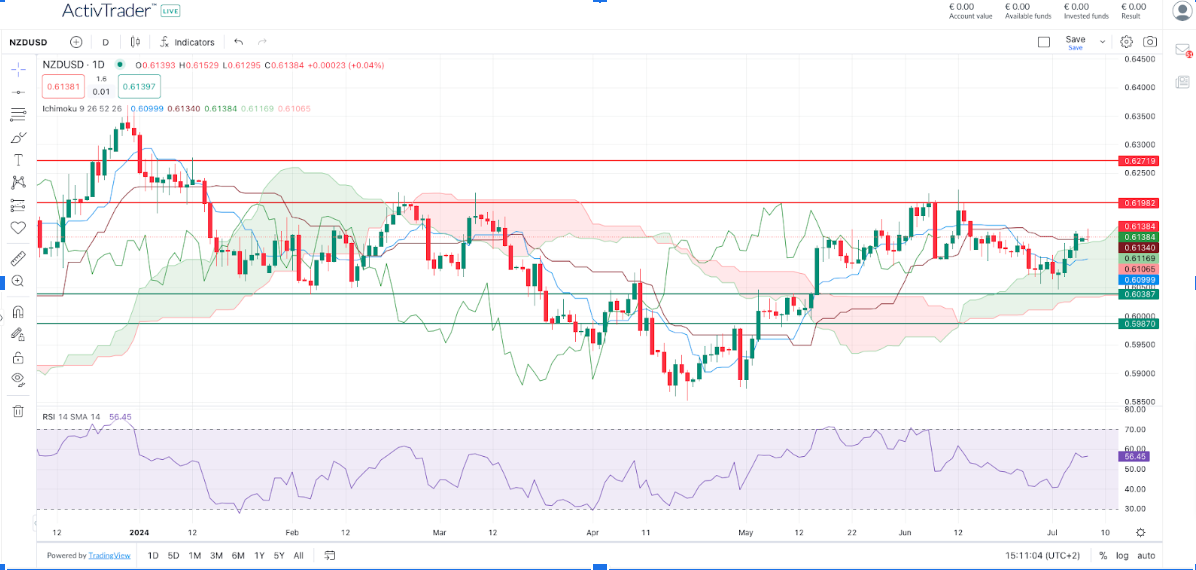 Daily Chart NZD/USD - Source: 100% Online Platform ActivTrader
On the above chart of the NZD/USD currency pair, prices have been trading upwards for the last week. A few days ago, they broke above the green Ichimoku cloud with a strong bullish Relative Strength Index (RSI) that bounced back from its neutral level of 50.
If prices keep moving upwards and above the Ichimoku cloud, they might head towards previous highs and important resistance levels such as around 0.61982 and 0.62719. On the other hand, if prices move back downwards inside the cloud, the next support levels to monitor would be the 0.60387 and 0.59870.
Statistics and Data That Could Influence the NZDUSD This Week
Tuesday 9th of July
●02:00 PM: American Fed Chair Powell Testimony
Wednesday 10th of July
●02:00 AM: NZ RBNZ Interest Rate Decision
●10:45 PM: NZ Food Inflation YoY
Thursday 11th of July
●12:30 PM: American Inflation Rate YoY
●10:30 PM: NZ Business PMI
Friday 12th of July
●12:30 PM: American PPI MoM
●02:00 PM: American Michigan Consumer Sentiment Prel
Daily Chart NZD/USD - Source: 100% Online Platform ActivTrader
On the above chart of the NZD/USD currency pair, prices have been trading upwards for the last week. A few days ago, they broke above the green Ichimoku cloud with a strong bullish Relative Strength Index (RSI) that bounced back from its neutral level of 50.
If prices keep moving upwards and above the Ichimoku cloud, they might head towards previous highs and important resistance levels such as around 0.61982 and 0.62719. On the other hand, if prices move back downwards inside the cloud, the next support levels to monitor would be the 0.60387 and 0.59870.
Statistics and Data That Could Influence the NZDUSD This Week
Tuesday 9th of July
●02:00 PM: American Fed Chair Powell Testimony
Wednesday 10th of July
●02:00 AM: NZ RBNZ Interest Rate Decision
●10:45 PM: NZ Food Inflation YoY
Thursday 11th of July
●12:30 PM: American Inflation Rate YoY
●10:30 PM: NZ Business PMI
Friday 12th of July
●12:30 PM: American PPI MoM
●02:00 PM: American Michigan Consumer Sentiment Prel Is Copper Losing Its Shine? Prices Tumble
Yesterday, Copper prices recorded their second worst single-day performance over the year to date, down 4.78% at $4.447 (the worst daily performance was May 22nd when they lost 5.95% to $4.7905). Investors and traders seem to have been cashing in on the industrial metal’s recent rally since it peaked at above $5.19 on May 20th.
Copper prices formed a long bearish marubozu (long candle with no shadow) yesterday that closed just above the bullish Ichimoku cloud with the Relative Strength Index (RSI) falling below its neutral level of 50. Today, prices are slightly rising. Can traders expect the commodity to keep falling or to rebound?
 Copper Daily Chart - Source: ActivTrader
May Mania: Copper Prices Surged in May as Demand Optimism Heated Up
Copper's story is one of remarkable longevity and adaptability. It stands as one of the first metals ever harnessed by humanity, playing a pivotal role in the rise of civilization.
But what made copper so valuable to our ancestors? Well, mostly its ease of shaping, resistance to corrosion, and exceptional conductivity. These unique characteristics propelled copper to the forefront of technological advancement throughout history.
Today, its applications continue to be incredibly diverse.
In construction, copper wiring forms the backbone of electrical systems in buildings, ensuring safe and reliable power distribution. The same conductivity makes it critical for power generation and transmission, efficiently carrying electricity from power plants to our homes and businesses. Copper's presence is ubiquitous in modern electronics, from intricate circuits in smartphones to complex wiring within computers. The strength and versatility of copper also make it essential for machinery and transportation components, keeping our industrial sector humming.
But copper's reach extends even further.
As the world strives for a cleaner future, copper is emerging as a surprising hero in the green revolution. From efficiently transmitting power generated by wind turbines and solar panels to powering electric vehicle charging stations and the vehicles themselves, copper is woven into the very fabric of this sustainable future.
The rise of artificial intelligence relies heavily on this remarkable metal. Copper wiring powers the data centres themselves, the humming hearts of the AI sector. It also provides the crucial connection to the power grid, ensuring a steady flow of electricity, and backs up generators in case of outages.
These are just some of the ways copper continues to shape our modern world, but these two uses – artificial intelligence and green energy – are likely the biggest drivers of copper's demand today and in the near future. This surge in demand optimism is likely to have pushed copper prices to record highs in May 2024.
Analysts predict continued strong demand as the world continues to urbanise, invest in clean energy infrastructure, and bet on the artificial intelligence hype to only be starting. This optimism about demand coupled with worries about copper supply are what drove the price of the industrial metal to a new record high last month.
Copper Prices Should Remain Volatile
Concerns about potential supply chain disruptions and the environmental impact of copper mining could create some volatility in the copper market going forward, as it has done in the past.
The global copper supply chain is indeed far from immune to disruptions. Geopolitical tensions, infrastructure bottlenecks, and unforeseen events like the December 2023 closure of the Cobre Panama mine due to protests over its environmental impact (which contributed over 1% of global production) can all create sudden gaps in supply.
These disruptions can lead to price spikes and market volatility, as seen in the record highs reached in May 2024. As copper demand is expected to increase faster than supply, the copper deficit is likely to deepen over the short-term, especially due to artificial intelligence projects.
The insatiable appetite of data centres for copper is poised to exacerbate a predicted global copper deficit. According to forecasts by JP Morgan, the additional power consumption required by these digital hubs could expand the projected 4 million metric ton copper deficit by 2030 by a staggering 2.6 million tons. This paints a concerning picture of a market already struggling to keep up with surging demand.
Breaking down the impact of data centres, Bank of America estimates a two-pronged attack on copper supplies: direct demand and indirect demand.
Data centres themselves are expected to directly consume a significant amount of copper. Estimates suggest a demand of around 200,000 metric tons annually between 2025 and 2028. This copper is needed for intricate wiring within servers, power distribution systems, and cooling infrastructure, as we’ve already explained.
The ever-growing power requirements of data centres create a ripple effect. To meet their energy needs, significant investments will be needed in building new power plants and upgrading electricity grids. Bank of America estimates this indirect demand for copper, driven by data centre power consumption, could reach at least 500,000 tons annually.
Given the already impending worldwide deficit, the presence of data centres will necessitate inventive measures to address the added strain. Recycling copper, investigating alternative minerals, uncovering new mines, and enhancing mining efficiency will all be vital measures in closing this widening gap between copper demand and supply disparity.
Additionally, increasing copper output is not an instantaneous process, but rather a gradual one. The extensive regulatory procedures, environmental factors, and infrastructure establishment linked to the commencement of new mines prevent their rapid deployment to resolve sudden shortages in supply.
So, are you ready to take advantage of copper price volatility?
Copper Daily Chart - Source: ActivTrader
May Mania: Copper Prices Surged in May as Demand Optimism Heated Up
Copper's story is one of remarkable longevity and adaptability. It stands as one of the first metals ever harnessed by humanity, playing a pivotal role in the rise of civilization.
But what made copper so valuable to our ancestors? Well, mostly its ease of shaping, resistance to corrosion, and exceptional conductivity. These unique characteristics propelled copper to the forefront of technological advancement throughout history.
Today, its applications continue to be incredibly diverse.
In construction, copper wiring forms the backbone of electrical systems in buildings, ensuring safe and reliable power distribution. The same conductivity makes it critical for power generation and transmission, efficiently carrying electricity from power plants to our homes and businesses. Copper's presence is ubiquitous in modern electronics, from intricate circuits in smartphones to complex wiring within computers. The strength and versatility of copper also make it essential for machinery and transportation components, keeping our industrial sector humming.
But copper's reach extends even further.
As the world strives for a cleaner future, copper is emerging as a surprising hero in the green revolution. From efficiently transmitting power generated by wind turbines and solar panels to powering electric vehicle charging stations and the vehicles themselves, copper is woven into the very fabric of this sustainable future.
The rise of artificial intelligence relies heavily on this remarkable metal. Copper wiring powers the data centres themselves, the humming hearts of the AI sector. It also provides the crucial connection to the power grid, ensuring a steady flow of electricity, and backs up generators in case of outages.
These are just some of the ways copper continues to shape our modern world, but these two uses – artificial intelligence and green energy – are likely the biggest drivers of copper's demand today and in the near future. This surge in demand optimism is likely to have pushed copper prices to record highs in May 2024.
Analysts predict continued strong demand as the world continues to urbanise, invest in clean energy infrastructure, and bet on the artificial intelligence hype to only be starting. This optimism about demand coupled with worries about copper supply are what drove the price of the industrial metal to a new record high last month.
Copper Prices Should Remain Volatile
Concerns about potential supply chain disruptions and the environmental impact of copper mining could create some volatility in the copper market going forward, as it has done in the past.
The global copper supply chain is indeed far from immune to disruptions. Geopolitical tensions, infrastructure bottlenecks, and unforeseen events like the December 2023 closure of the Cobre Panama mine due to protests over its environmental impact (which contributed over 1% of global production) can all create sudden gaps in supply.
These disruptions can lead to price spikes and market volatility, as seen in the record highs reached in May 2024. As copper demand is expected to increase faster than supply, the copper deficit is likely to deepen over the short-term, especially due to artificial intelligence projects.
The insatiable appetite of data centres for copper is poised to exacerbate a predicted global copper deficit. According to forecasts by JP Morgan, the additional power consumption required by these digital hubs could expand the projected 4 million metric ton copper deficit by 2030 by a staggering 2.6 million tons. This paints a concerning picture of a market already struggling to keep up with surging demand.
Breaking down the impact of data centres, Bank of America estimates a two-pronged attack on copper supplies: direct demand and indirect demand.
Data centres themselves are expected to directly consume a significant amount of copper. Estimates suggest a demand of around 200,000 metric tons annually between 2025 and 2028. This copper is needed for intricate wiring within servers, power distribution systems, and cooling infrastructure, as we’ve already explained.
The ever-growing power requirements of data centres create a ripple effect. To meet their energy needs, significant investments will be needed in building new power plants and upgrading electricity grids. Bank of America estimates this indirect demand for copper, driven by data centre power consumption, could reach at least 500,000 tons annually.
Given the already impending worldwide deficit, the presence of data centres will necessitate inventive measures to address the added strain. Recycling copper, investigating alternative minerals, uncovering new mines, and enhancing mining efficiency will all be vital measures in closing this widening gap between copper demand and supply disparity.
Additionally, increasing copper output is not an instantaneous process, but rather a gradual one. The extensive regulatory procedures, environmental factors, and infrastructure establishment linked to the commencement of new mines prevent their rapid deployment to resolve sudden shortages in supply.
So, are you ready to take advantage of copper price volatility?